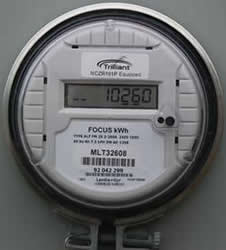
Figure 1 - Smart meter
The costs involved in generating electricity are continuing to rise. Coupled with that is the increase in population, the increase in available electrical appliances and devices, which leads to an increase in the demands for electrical power.
Smart meters have the ability to record the kilowatt energy usage of a home by the hour. By knowing electrical power usage by the day and hour allows the utility to have different kilowatt rates for different times of the day.
By pricing the cost of a kilowatt of electricity at a higher rate during peak demand periods, the utility hopes that individuals will take advantage of lower kilowatt costs by using electrical appliances at times when the demands for electricity are lower. This means that the electrical utility will require less electrical generation capability at peak demand periods.
How does smart grid technology work?
A new generation electrical meter is installed, replacing the existing meter. This new generation meter stores kilowatt usage by the hour, stores the result and either transmits the information to the utility’s billing computer or waits to be polled to download its information.
The smart meter is similar in size to the older style meters. Smart meters use digital displays rather than having a group of numbered dials, as shown in Figure 1.
The use of smart meter technology requires no changes to the electrical wiring, distribution panels or load centers in the home. The only thing that is changes is the electrical utilities meter.
Although each utility that implements smart meter will have their own formula for demand and their own formula to determine the incentives for using electrical power during low periods of demand.
Following is a typical type of incentive program implemented using smart meter technology.
In this example, the utility has three possible daily rates and has a different program for summer and winter, because in many geographic areas, hourly demand varies dramatically depending on the season.

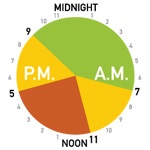
Figure 3 - Summer peak hour chart

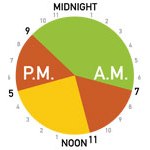
Figure 4 - Winter peak hour chart

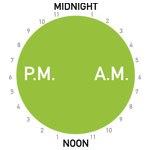
Figure 5 - Weakends & holidays peak hour chart
Summer – Monday to Friday:
In the summer the utility in our example has its peak period between 11 a.m. and 5 p.m. Monday through Friday. The high peak demand is created by air conditioning load, when the sun is at its peak.
The utility offers a low price during the hours of 9 p.m. to 7 a.m., a midrange price during the hours of 7 a.m. to 11 a.m. and 5 p.m. to 9.pm and its highest price during peak load of 11 a.m. to 5 p.m. - Monday to Friday, as shown in Figure 3.
Winter – Monday to Friday:
In the winter the utility in our example has two peak periods. The first is between 7 a.m. and 11 a.m. The second is between 5 p.m. and 9 p.m. Monday through Friday. The high peak demand is created by furnaces being turned on, as well as cooking and the increase in electrical energy for lighting due to shorter amounts of daylight during the winter period, as shown in Figure 4.
Saturday, Sunday & Holidays:
Because industrial and commercial demand is substantially reduced on weekends and statutory holidays, the utility offers its lowest rate in both winter and summer, as shown in Figure 5.
Possible savings:
Each utility prices its kilowatt power based on their costs and adjusts the incentive programs accordingly.
However, it is not uncommon for utilities to offer as much as a 50% decrease in the cost of a kilowatt hour during low demand periods versus high or peak demand periods.
Table 1 provides an indication of the savings that the homeowner might obtained by utilizing the benefits provided by a smart meter, based on our typical incentive program and a peak power kilowatt cost of $0.14. The appliances chosen are those that a homeowner can, with relative ease, control when they are being used.

* includes electric hot water
